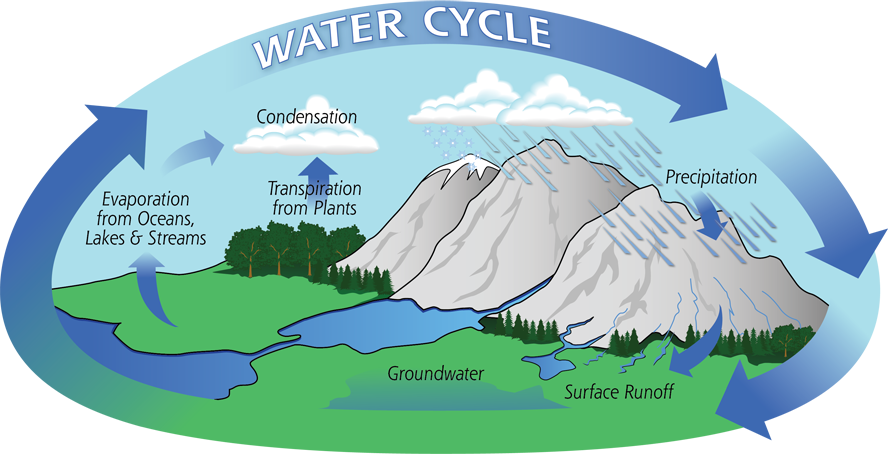
Technical descriptions focus on a visualization of an object, concept, mechanism, or process. The water cycle image on the right shows a visualization of the process that takes groundwater to evaporation, condensation, and precipitation. These descriptions pair textual information with visual information (such as photographs, illustrations, diagrams, and videos).
Use the strategies below to use document design to make your instructions easy to identify at a glance.
Apply These Strategies to Your Project
- Use standard margins (generally 1") on all sides of your document. Keep your paper to letter size (8.5" by 11").
- Choose a font size that is large enough to read without magnification.
- Avoid fonts in all caps, since they decrease readability. See the LinkedIn Learning video “Avoid All Caps and Underlined Text” (6m 23s) for more information.
- Arrange your text so that it uses flush left, ragged right alignment. See LinkedIn Learning videos “Favor flush-left, ragged-right body text” (4m 14s), and the article “F-Shaped Pattern For Reading Web Content” by Jakob Nielsen.
- Apply the design principles of Contrast, Repetition, Alignment, and Proximity (CRAP) to improve your document design. See CRAP Design Principles.
- Structure your document so the information is well-organized and easy to navigate. In Markel & Selber, see “Paragraph Length” in Chapter 9 (p. 210) and “Guidelines: Dividing Long Paragraphs” (p. 211). See the LinkedIn Learning video Managing Paragraph Lengths (3m 20s).
- Add strong headings and subheadings to your document, if appropriate. In Markel & Selber, see “Writing Clear, Informative Headings” in Chapter 9 (pp. 199–201) and “Guidelines: Revising Headings” also in Chapter 9 (pp. 201–202). See the LinkedIn Learning video and Create Information-Rich Signposts (5m 22s).
- Apply this design advice from the textbook to your draft:
- Guidelines: Designing Easy-To-Read Text, on p. 292
- Using Color Effectively, on pp. 309–312
- Integrate images smoothly in your documents and include appropriate labels and documentation for all images. See Chapter 12 of Markel and Selber’s Technical Communication, “Creating Graphics.” To learn about the tools available in your word processor, watch one of the following videos, both from LinkedIn Learning:
- Format text around images (4m 24s), from Google Docs: Formatting in Depth
- Add and customize graphics in a document (9m 28s), from Word Tips Weekly
- Add visuals to a technical report (9m 0s), from Technical Writing: Reports
Photo credit: Diagram of the water cycle, from Precipitation Education website by NASA, used under public domain.